Economic Capsuleers!
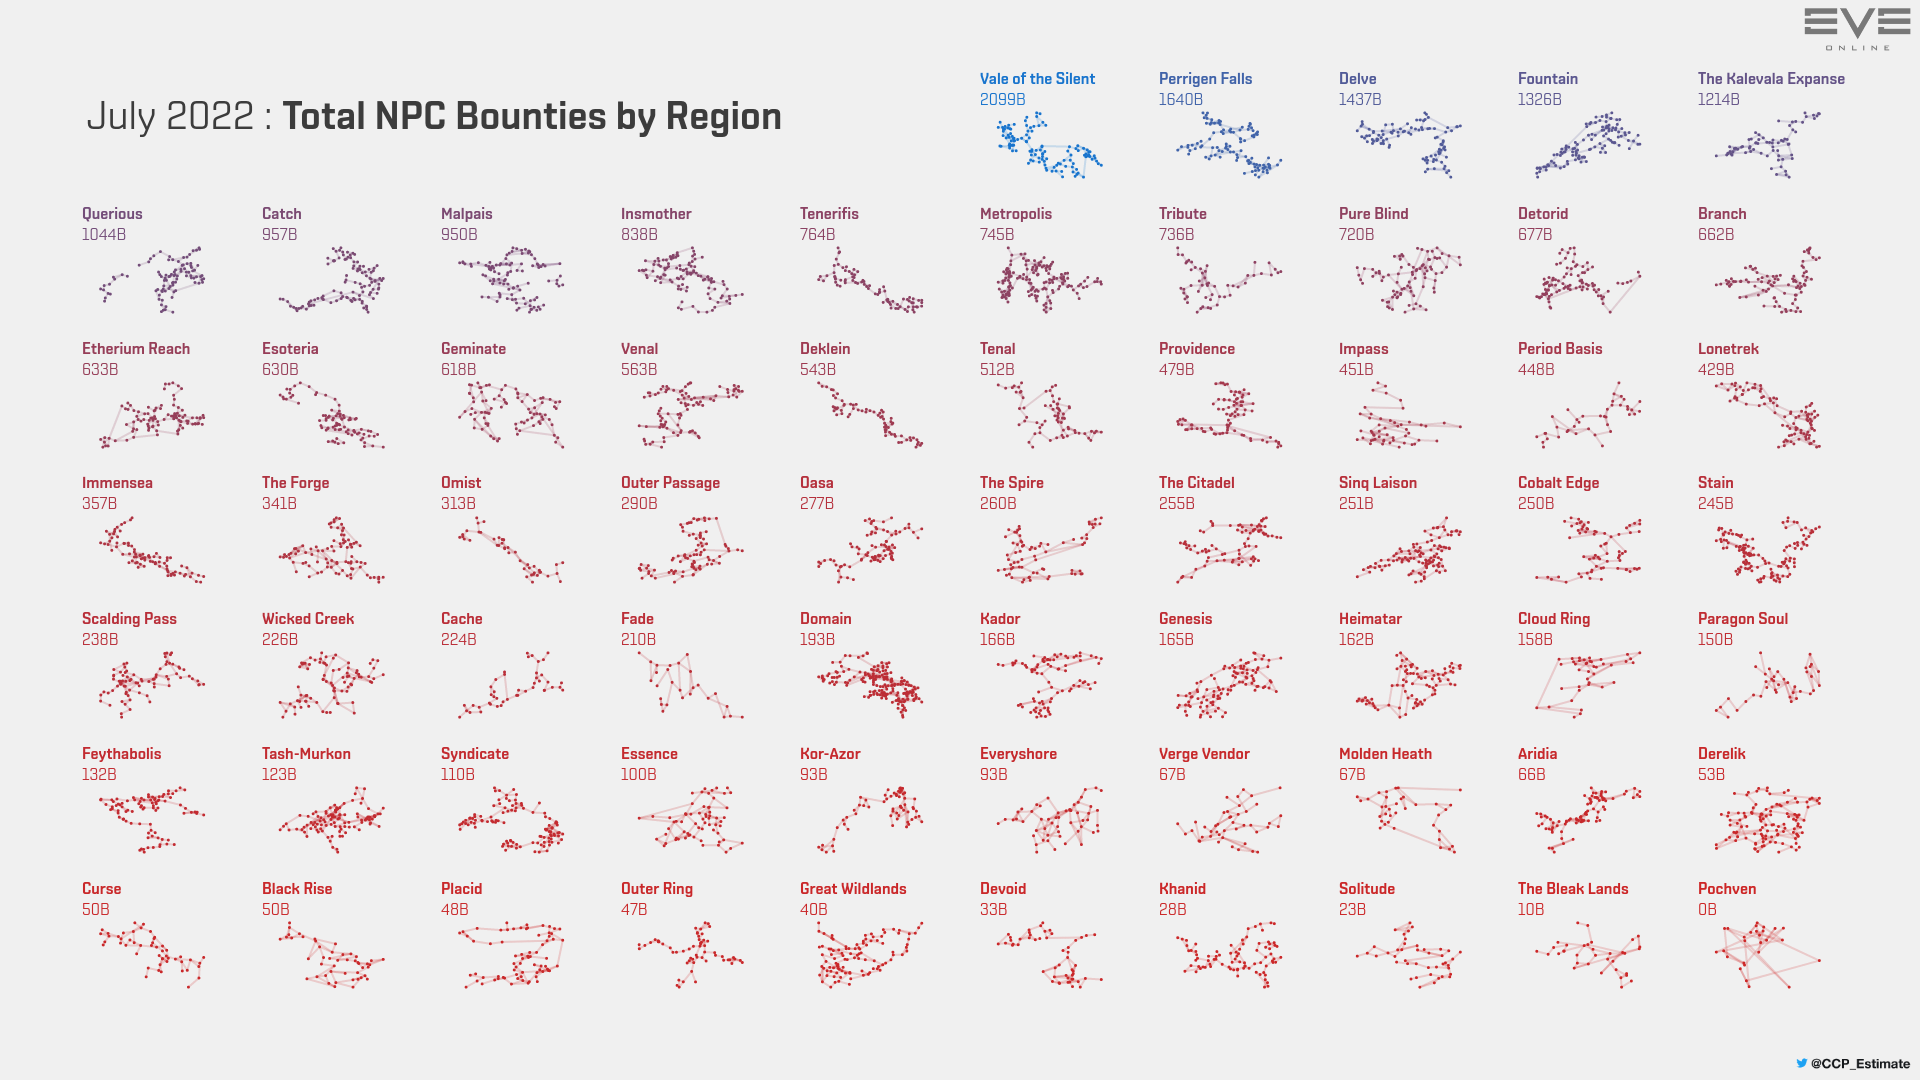
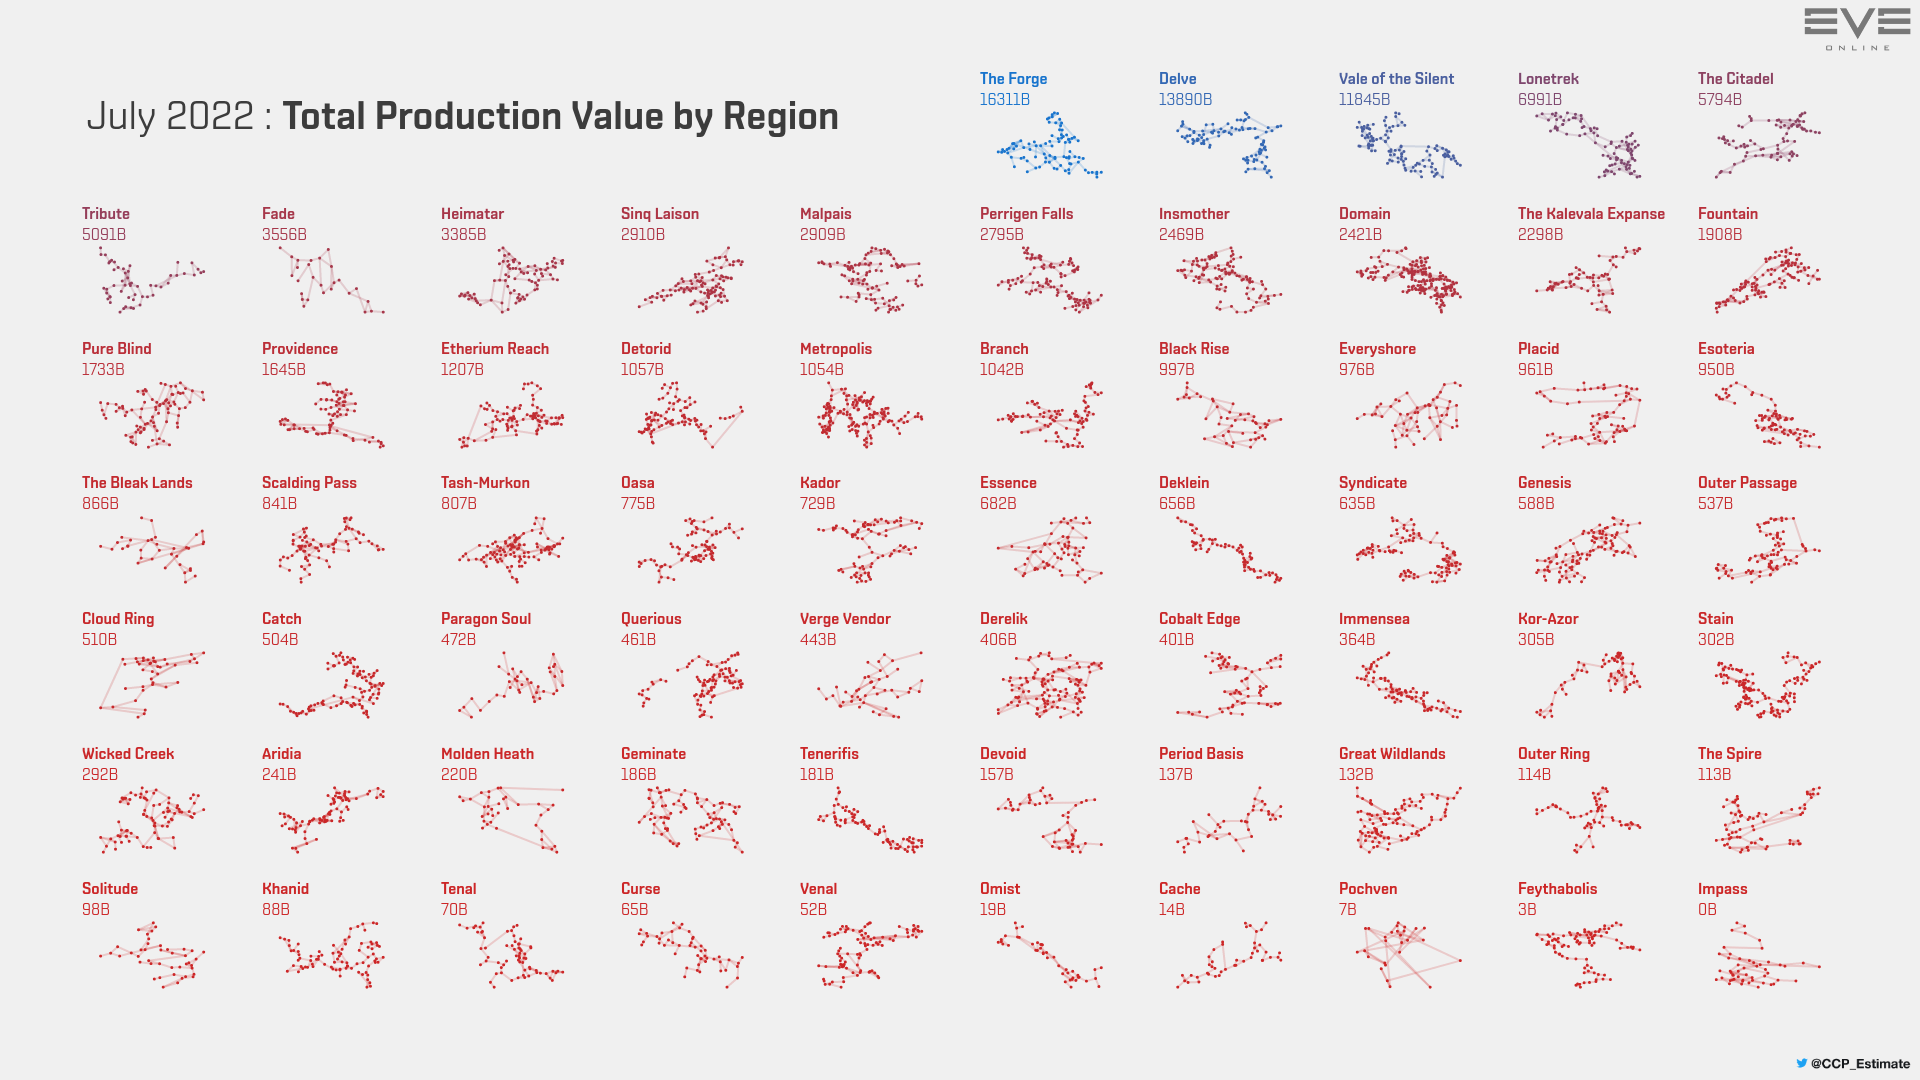
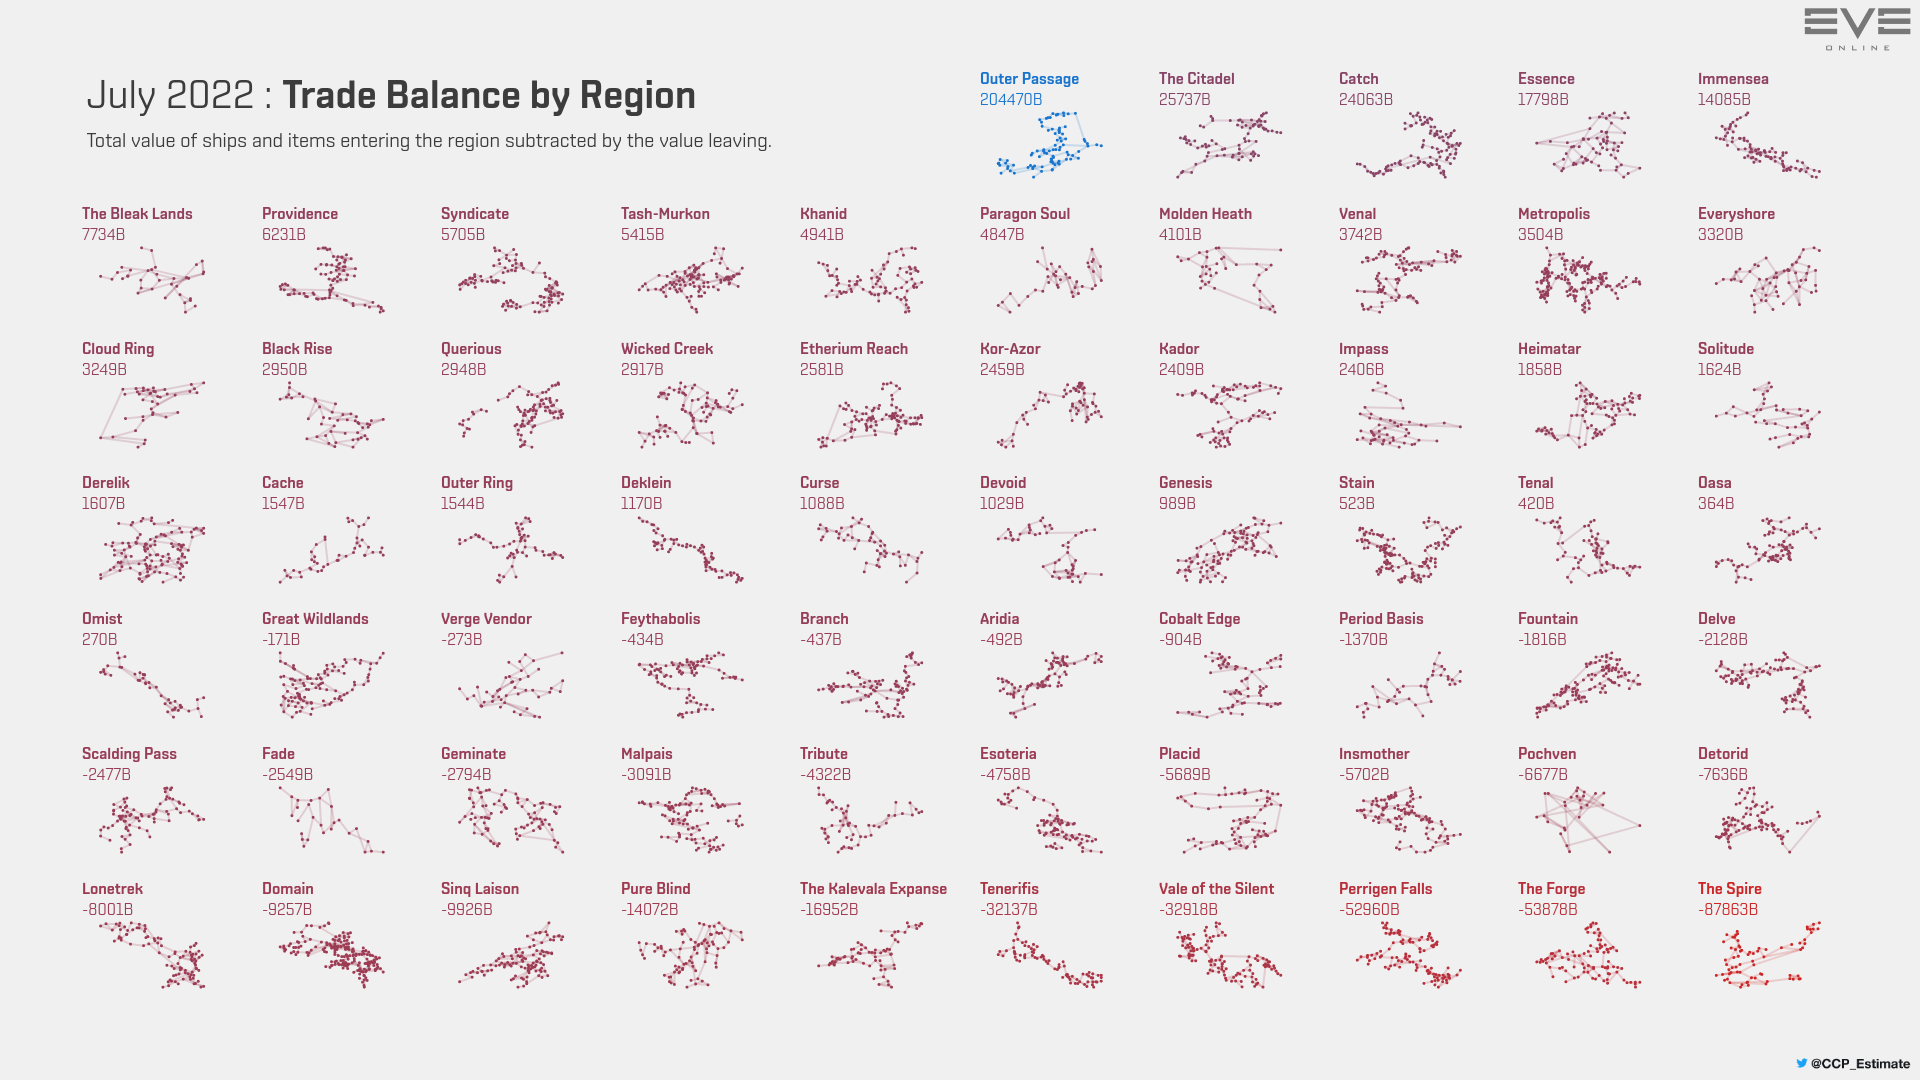
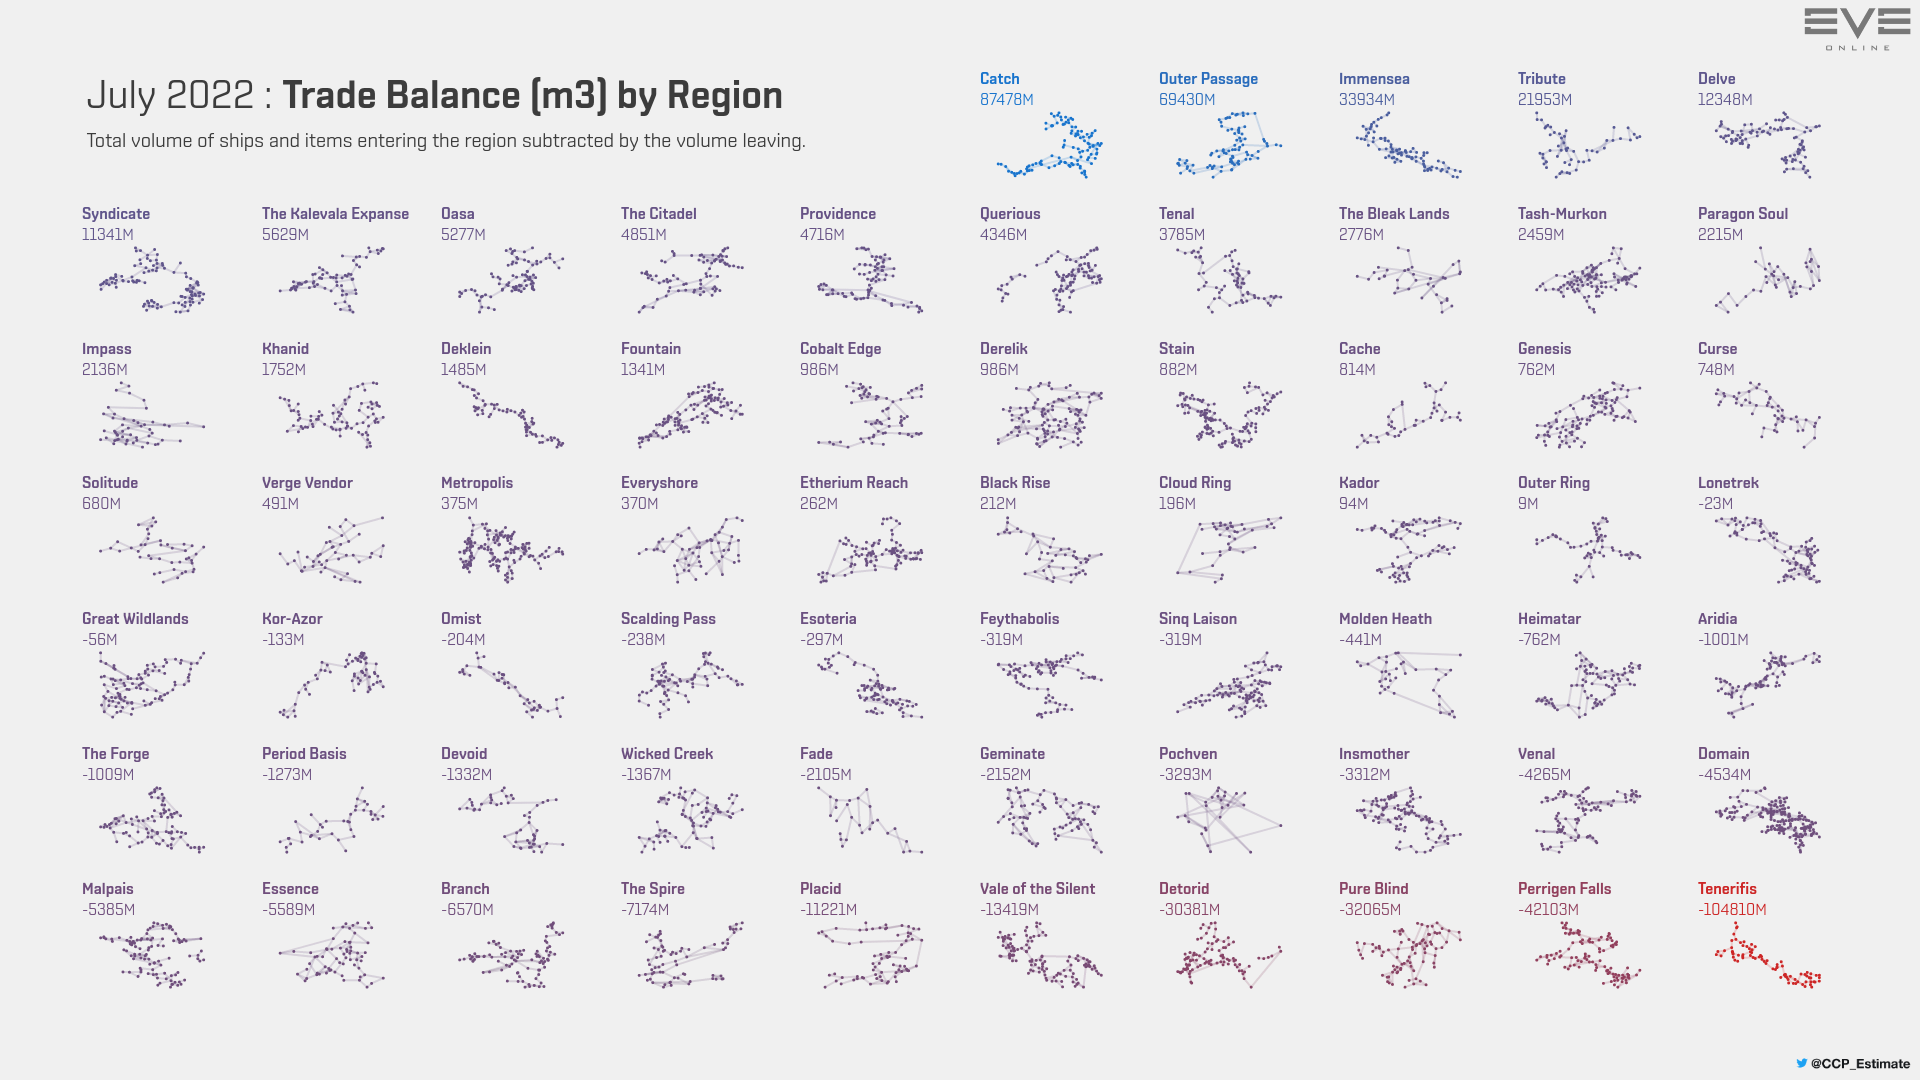
The Monthly Economic Report for July 2022 is now available!
You can download all of the raw data used in this report here. Each image can be enlarged by clicking on it. As with the previous report, there is also a limited number of "Dark Mode" graphs available in the download too!

To join the player discussion, please visit the official thread on EVE Online forums.


